Day 4: By 10/16 (A) & 10/17 (B)
Introduction
An earthquake is sudden ground movement caused by the sudden release of energy stored in rocks. Earthquakes happen when so much stress builds up in the rocks that the rocks rupture. The energy is transmitted by seismic waves. Each year there are more than 150,000 earthquakes strong enough to be felt by people and 900,000 recorded by seismometers!
Causes of Earthquakes
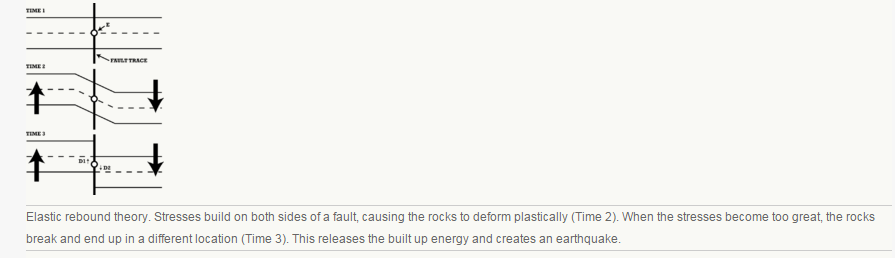
The description of how earthquakes occur is called elastic rebound theory (Figure below).
An earthquake is sudden ground movement caused by the sudden release of energy stored in rocks. Earthquakes happen when so much stress builds up in the rocks that the rocks rupture. The energy is transmitted by seismic waves. Each year there are more than 150,000 earthquakes strong enough to be felt by people and 900,000 recorded by seismometers!
Causes of Earthquakes
The description of how earthquakes occur is called elastic rebound theory (Figure below).
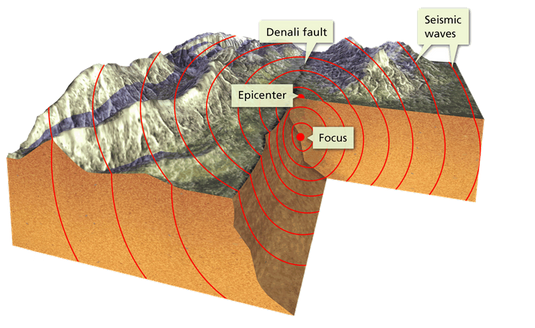
In an earthquake, the initial point where the rocks rupture in the crust is called the focus. The epicenter is the point on the land surface that is directly above the focus. In about 75% of earthquakes, the focus is in the top 10 to 15 kilometers (6 to 9 miles) of the crust. Shallow earthquakes cause the most damage because the focus is near where people live. However, it is the epicenter of an earthquake that is reported by scientists and the media (Figure below).
Earthquake Zones
Nearly 95% of all earthquakes take place along one of the three types of plate boundaries, but earthquakes do occur along all three types of plate boundaries.
Nearly 95% of all earthquakes take place along one of the three types of plate boundaries, but earthquakes do occur along all three types of plate boundaries.
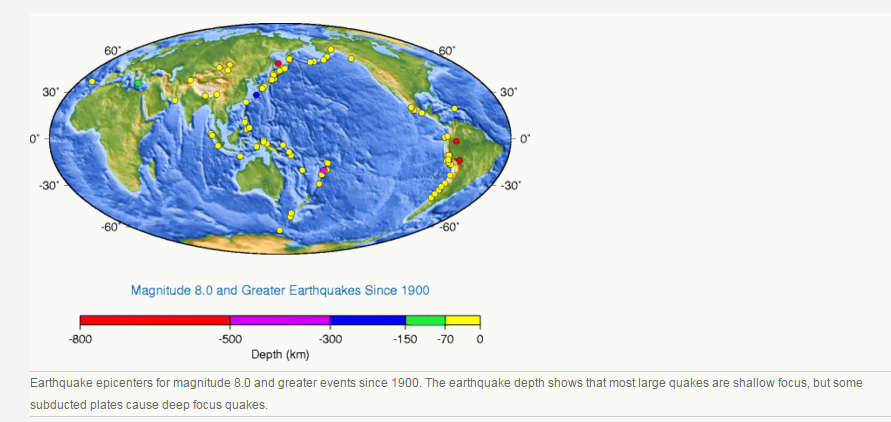
- About 80% of all earthquakes strike around the Pacific Ocean basin because it is lined with convergent and transform boundaries (Figure below).
- About 15% take place in the Mediterranean-Asiatic Belt, where convergence is causing the Indian Plate to run into the Eurasian Plate.
- The remaining 5% are scattered around other plate boundaries or are intraplate earthquakes.
Transform plate boundaries
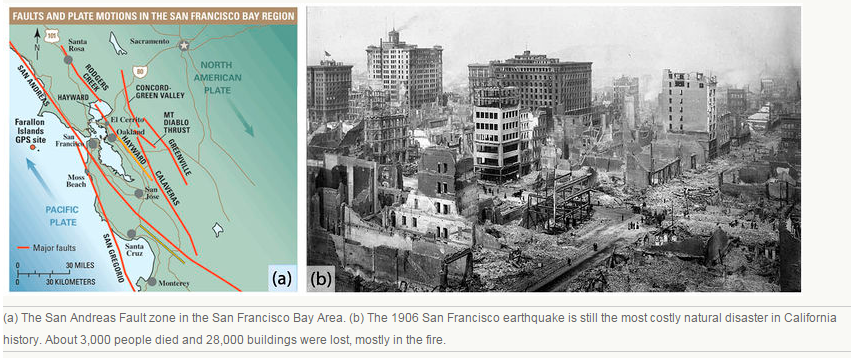
Deadly earthquakes occur at transform plate boundaries. Transform faults have shallow focus earthquakes. The faults along the San Andreas Fault zone produce around 10,000 earthquakes a year. Most are tiny, but occasionally one is massive. In the San Francisco Bay Area, the Hayward Fault was the site of a magnitude 7.0 earthquake in 1868. The 1906 quake on the San Andreas Fault had a magnitude estimated at about 7.9 (Figure below).
Deadly earthquakes occur at transform plate boundaries. Transform faults have shallow focus earthquakes. The faults along the San Andreas Fault zone produce around 10,000 earthquakes a year. Most are tiny, but occasionally one is massive. In the San Francisco Bay Area, the Hayward Fault was the site of a magnitude 7.0 earthquake in 1868. The 1906 quake on the San Andreas Fault had a magnitude estimated at about 7.9 (Figure below).
Other California earthquakes:
New Zealand also has strike-slip earthquakes, about 20,000 a year! Only a small percentage of those are large enough to be felt. A 6.3 quake in Christchurch in February 2011 killed about 180 people.
Convergent plate boundaries
Convergent plate boundaries produce earthquakes all around the Pacific Ocean basin. The Philippine Plate and the Pacific Plate subduct beneath Japan, creating a chain of volcanoes and as many as 1,500 earthquakes annually.
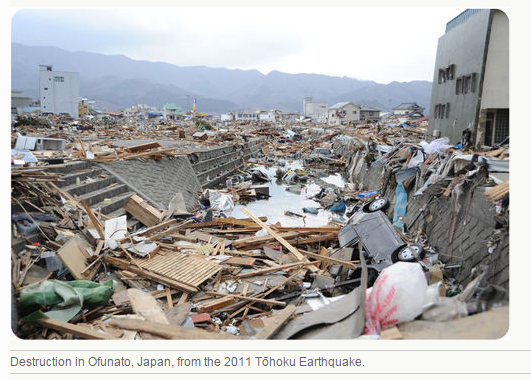
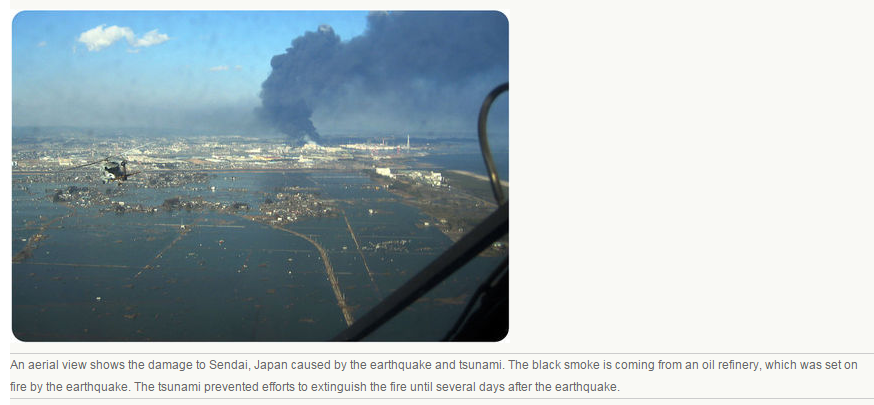
In March 2011 an enormous 9.0 earthquake struck off of Sendai in northeastern Japan. This quake, called the 2011 Tōhoku earthquake, was the most powerful ever to strike Japan and one of the top five known in the world. Damage from the earthquake was nearly overshadowed by the tsunami it generated, which wiped out coastal cities and towns (Figurebelow). Two months after the earthquake, about 25,000 people were dead or missing, and 125,000 buildings had been damaged or destroyed. Aftershocks, some as large as major earthquakes, have continued to rock the region.
- 1989: Loma Prieta earthquake near Santa Cruz, California. Magnitude 7.1 quake, 63 deaths, 3,756 injuries, 12,000+ people homeless, property damage about $6 billion.
- 1994: Northridge earthquake on a blind thrust fault near Los Angeles. Magnitude 6.7, 72 deaths, 12,000 injuries, damage estimated at $12.5 billion.
New Zealand also has strike-slip earthquakes, about 20,000 a year! Only a small percentage of those are large enough to be felt. A 6.3 quake in Christchurch in February 2011 killed about 180 people.
Convergent plate boundaries
Convergent plate boundaries produce earthquakes all around the Pacific Ocean basin. The Philippine Plate and the Pacific Plate subduct beneath Japan, creating a chain of volcanoes and as many as 1,500 earthquakes annually.
In March 2011 an enormous 9.0 earthquake struck off of Sendai in northeastern Japan. This quake, called the 2011 Tōhoku earthquake, was the most powerful ever to strike Japan and one of the top five known in the world. Damage from the earthquake was nearly overshadowed by the tsunami it generated, which wiped out coastal cities and towns (Figurebelow). Two months after the earthquake, about 25,000 people were dead or missing, and 125,000 buildings had been damaged or destroyed. Aftershocks, some as large as major earthquakes, have continued to rock the region.
The Pacific Northwest of the United States is at risk from a potentially massive earthquake that could strike any time. Subduction of the Juan de Fuca plate beneath North America produces active volcanoes, but large earthquakes only hit every 300 to 600 years. The last was in 1700, with an estimated magnitude of around 9.
Divergent Plate Boundaries
Earthquakes at mid-ocean ridges are small and shallow because the plates are young, thin, and hot. On land where continents split apart, earthquakes are larger and stronger.
Intraplate Earthquakes
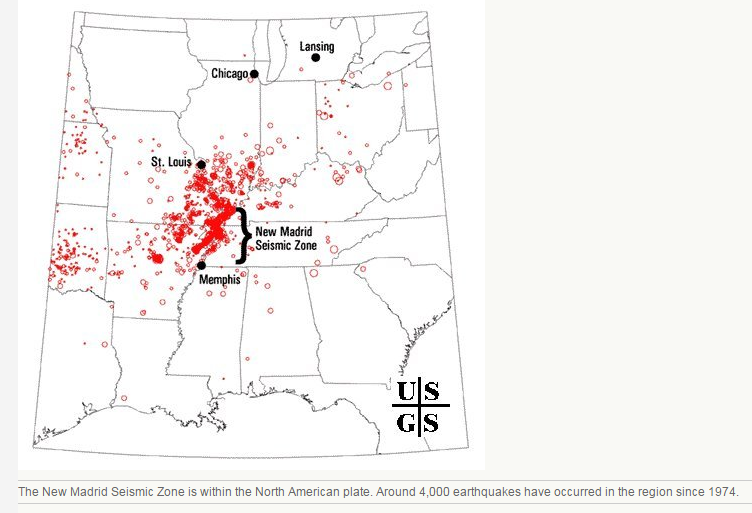
Intraplate earthquakes are the result of stresses caused by plate motions acting in solid slabs of lithosphere. In 1812, a magnitude 7.5 earthquake struck near New Madrid, Missouri. The earthquake was strongly felt over approximately 50,000 square miles and altered the course of the Mississippi River. Because very few people lived there at the time, only 20 people died. Many more people live there today (Figure below). A similar earthquake today would undoubtedly kill many people and cause a great deal of property damage.
Divergent Plate Boundaries
Earthquakes at mid-ocean ridges are small and shallow because the plates are young, thin, and hot. On land where continents split apart, earthquakes are larger and stronger.
Intraplate Earthquakes
Intraplate earthquakes are the result of stresses caused by plate motions acting in solid slabs of lithosphere. In 1812, a magnitude 7.5 earthquake struck near New Madrid, Missouri. The earthquake was strongly felt over approximately 50,000 square miles and altered the course of the Mississippi River. Because very few people lived there at the time, only 20 people died. Many more people live there today (Figure below). A similar earthquake today would undoubtedly kill many people and cause a great deal of property damage.
Seismic Waves
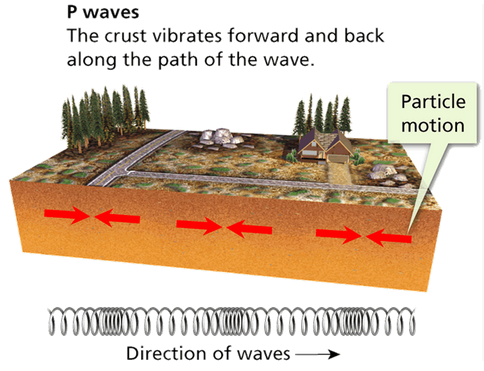
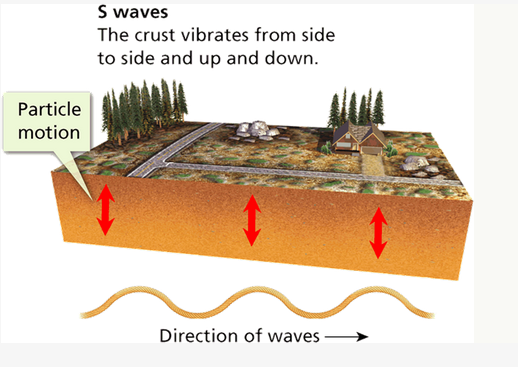
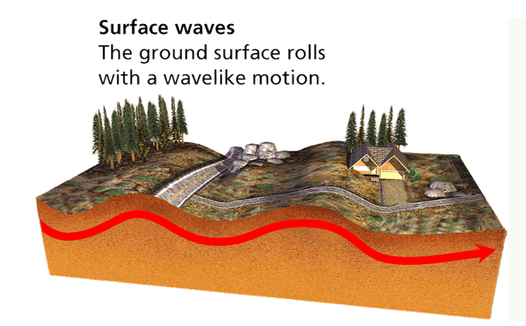
The energy from earthquakes travels in seismic waves. The study of seismic waves is known as seismology. Seismologists use seismic waves to learn about earthquakes and also to learn about the Earth’s interior. The two types of seismic waves described in “Plate Tectonics,” P-waves and S-waves, are known as body waves because they move through the solid body of the Earth. P-waves are the fastest and travel through solids, liquids, and gases. S-waves only move through solids. Surface waves travel along the ground, outward from an earthquake’s epicenter. Surface waves are the slowest of all seismic waves, traveling at 2.5 km (1.5 miles) per second. There are two types of surface waves (Figure below).
The energy from earthquakes travels in seismic waves. The study of seismic waves is known as seismology. Seismologists use seismic waves to learn about earthquakes and also to learn about the Earth’s interior. The two types of seismic waves described in “Plate Tectonics,” P-waves and S-waves, are known as body waves because they move through the solid body of the Earth. P-waves are the fastest and travel through solids, liquids, and gases. S-waves only move through solids. Surface waves travel along the ground, outward from an earthquake’s epicenter. Surface waves are the slowest of all seismic waves, traveling at 2.5 km (1.5 miles) per second. There are two types of surface waves (Figure below).
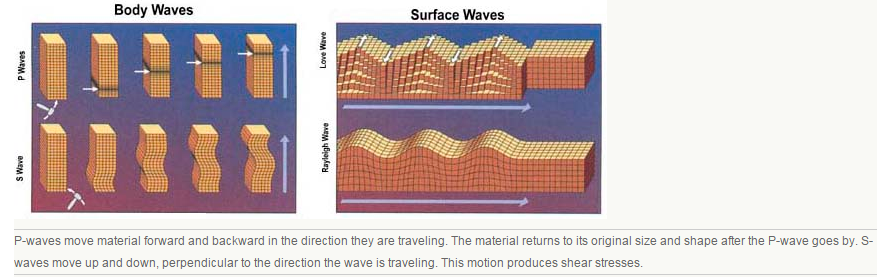
In an earthquake, body waves produce sharp jolts. The rolling motions of surface waves do most of the damage in an earthquake.
Tsunami
Tsunami are deadly ocean waves from an earthquake. The sharp jolt of an undersea quake forms a set of waves that travel through the sea entirely unnoticed. When they come onto shore, they can grow to enormous heights. Fortunately, few undersea earthquakes generate tsunami.
Tsunami are deadly ocean waves from an earthquake. The sharp jolt of an undersea quake forms a set of waves that travel through the sea entirely unnoticed. When they come onto shore, they can grow to enormous heights. Fortunately, few undersea earthquakes generate tsunami.
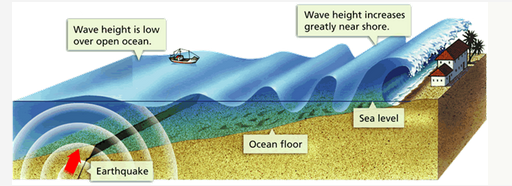
The Boxing Day Tsunami of December 26, 2004 was by far the deadliest of all time (Figure below). The tsunami was caused by the 2004 Indian Ocean Earthquake. With a magnitude of 9.2, it was the second largest earthquake ever recorded. The extreme movement of the crust displaced trillions of tons of water along the entire length of the rupture. Several tsunami waves were created with about 30 minutes between the peaks of each one. The waves that struck nearby Sumatra 15 minutes after the quake reached more than 10 meters (33 feet) in height. The size of the waves decreased with distance from the earthquake and were about 4 meters (13 feet) high in Somalia.
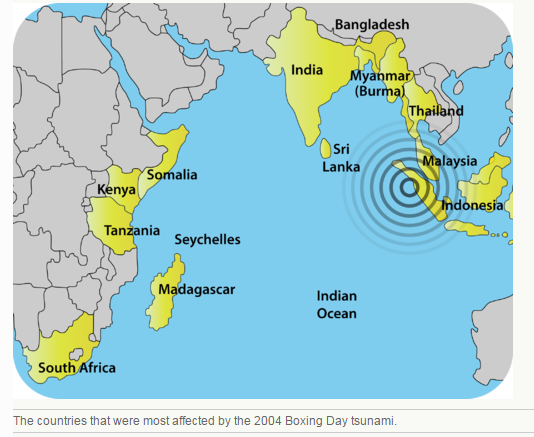
About 230,000 people died in eight countries (Figure below) with fatalities even as far away as South Africa, nearly 8,000 kilometers (5,000 miles) from the earthquake epicenter. More than 1.2 million people lost their homes and many more lost their ways of making a living.

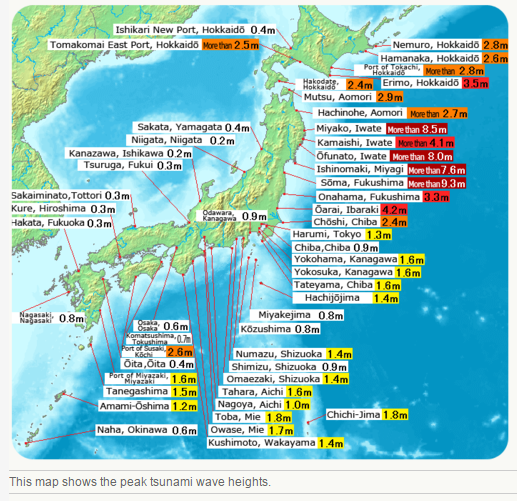
The 2011 Tōhoku earthquake in Japan created massive tsunami waves that hit the island nation. As seen in Figurebelow, waves in some regions topped 9 meters (27 feet). The tsunami did much more damage than the massive earthquake. Worst was the damage done to nuclear power plants along the northeastern coast.
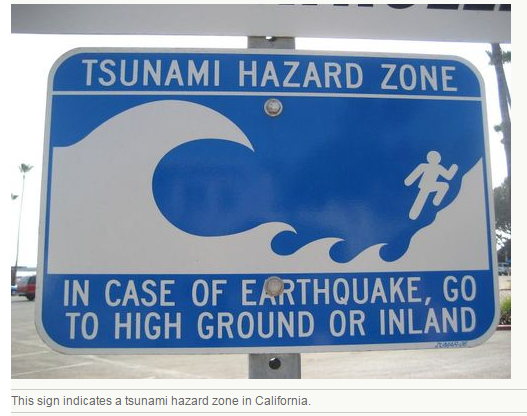
As a result of the 2004 tsunami, an Indian Ocean warning system was put into operation in June 2006. Prior to 2004, no one had thought a large tsunami was possible in the Indian Ocean. In comparison, a warning system has been in effect around the Pacific Ocean for more than 50 years (Figure below). The system was used to warn of possible tsunami waves after the Tōhoku earthquake. People were evacuated along many Pacific coastlines although the waves were not nearly as large as those that struck Japan shortly after the quake.
Measuring Earthquakes
Seismograms record seismic waves. Over the past century, scientists have developed several ways of measuring earthquake intensity. The currently accepted method is the moment magnitude scale, which measures the total amount of energy released by the earthquake. At this time, seismologists have not found a reliable method for predicting earthquakes.
Measuring Magnitude
A seismograph produces a graph-like representation of the seismic waves it receives and records them onto a seismogram (Figure below). Seismograms contain information that can be used to determine how strong an earthquake was, how long it lasted, and how far away it was. Modern seismometers record ground motions using electronic motion detectors. The data are then kept digitally on a computer
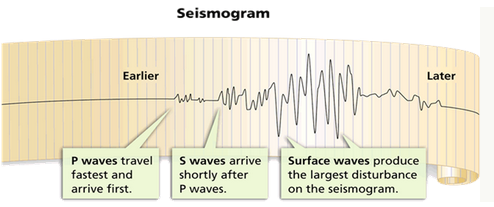
If a seismogram records P-waves and surface waves but not S-waves, the seismograph was on the other side of the Earth from the earthquake. The amplitude of the waves can be used to determine the magnitude of the earthquake.
Finding the Epicenter
To locate an earthquake epicenter:
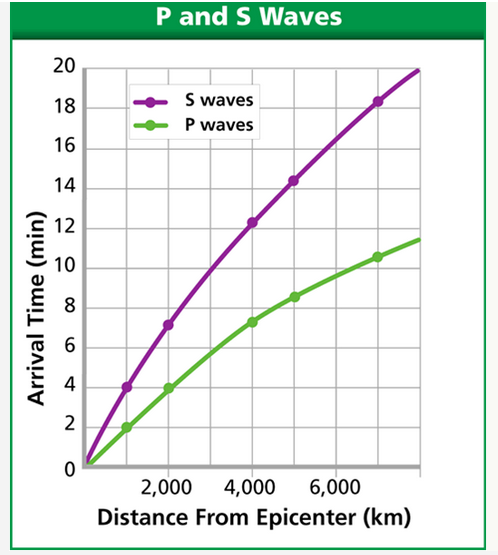
1. Scientists first determine the epicenter distance from three different seismographs. The longer the time between the arrival of the P-wave and S-wave, the farther away is the epicenter. So the difference in the P and S wave arrival times determines the distance between the epicenter and a seismometer.
Finding the Epicenter
To locate an earthquake epicenter:
1. Scientists first determine the epicenter distance from three different seismographs. The longer the time between the arrival of the P-wave and S-wave, the farther away is the epicenter. So the difference in the P and S wave arrival times determines the distance between the epicenter and a seismometer.
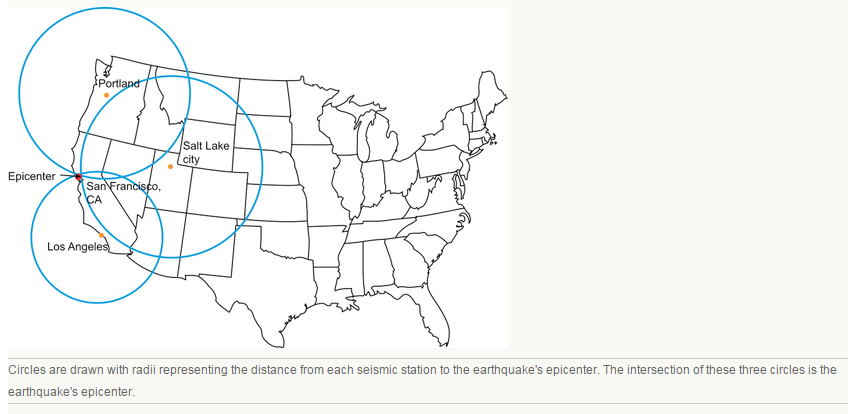
2. The scientist then draws a circle with a radius equal to the distance from the epicenter for that seismograph. The epicenter is somewhere along that circle. This is done for three locations. Using data from two seismographs, the two circles will intercept at two points. A third circle will intercept the other two circles at a single point. This point is the earthquake epicenter (Figure below). Although useful for decades, this technique has been replaced by digital calculations
Measuring Earthquakes
People have always tried to quantify the size of and damage done by earthquakes. Since early in the 20th century, there have been three methods. What are the strengths and weaknesses of each?
The Richter scale and the moment magnitude scale are logarithmic.
How does the amplitude of the largest seismic wave of a magnitude 5 earthquake compare with the largest wave of a magnitude 4 earthquake? How does it compare with a magnitude 3 quake? The amplitude of the largest seismic wave of a magnitude 5 quake is 10 times that of a magnitude 4 quake and 100 times that of a magnitude 3 quake.
How does an increase in two integers on the moment magnitude scale compare in terms of the amount of energy released? Two integers equals a 900-fold increase in released energy.
Which scale do you think is best? With the Richter scale, a single sharp jolt measures higher than a very long intense earthquake that releases more energy. The moment magnitude scale more accurately reflects the energy released and the damage caused. Most seismologists now use the moment magnitude scale.
Earthquake Prediction
Scientists are a long way from being able to predict earthquakes. A good prediction must be accurate as to where an earthquake will occur, when it will occur, and at what magnitude it will be so that people can evacuate. An unnecessary evacuation is expensive and causes people not to believe authorities the next time an evacuation is ordered.
Where an earthquake will occur is the easiest feature to predict. Scientists know that earthquakes take place at plate boundaries and tend to happen where they’ve occurred before. Earthquake-prone communities should always be prepared for an earthquake. These communities can implement building codes to make structures earthquake safe.
When an earthquake will occur is much more difficult to predict. Since stress on a fault builds up at the same rate over time, earthquakes should occur at regular intervals. But so far scientists cannot predict when quakes will occur even to within a few years.
Signs sometimes come before a large earthquake. Small quakes, called foreshocks, sometimes occur a few seconds to a few weeks before a major quake. However, many earthquakes do not have foreshocks and small earthquakes are not necessarily followed by a large earthquake. Often, the rocks around a fault will dilate as microfractures form. Ground tilting, caused by the buildup of stress in the rocks, may precede a large earthquake, but not always. Water levels in wells fluctuate as water moves into or out of fractures before an earthquake. This is also an uncertain predictor of large earthquakes. The relative arrival times of P-waves and S-waves also decreases just before an earthquake occurs.
Folklore tells of animals behaving erratically just before an earthquake. Mostly these anecdotes are told after the earthquake. If indeed animals sense danger from earthquakes or tsunami, scientists do not know what it is they could be sensing, but they would like to find out.
People have always tried to quantify the size of and damage done by earthquakes. Since early in the 20th century, there have been three methods. What are the strengths and weaknesses of each?
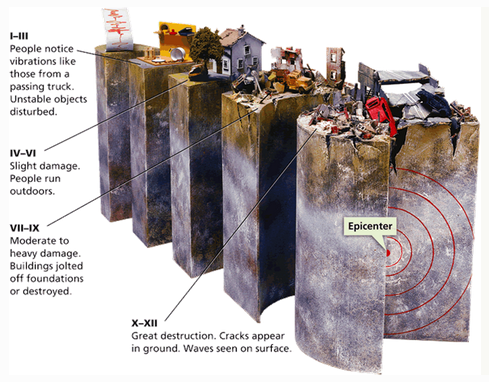
- Mercalli Intensity Scale. Earthquakes are described in terms of what nearby residents felt and the damage that was done to nearby structures.
- Richter magnitude scale. Developed in 1935 by Charles Richter, this scale uses a seismometer to measure the magnitude of the largest jolt of energy released by an earthquake.
- Moment magnitude scale. Measures the total energy released by an earthquake. Moment magnitude is calculated from the area of the fault that is ruptured and the distance the ground moved along the fault.
The Richter scale and the moment magnitude scale are logarithmic.
- The amplitude of the largest wave increases ten times from one integer to the next.
- An increase in one integer means that thirty times more energy was released.
- These two scales often give very similar measurements.
How does the amplitude of the largest seismic wave of a magnitude 5 earthquake compare with the largest wave of a magnitude 4 earthquake? How does it compare with a magnitude 3 quake? The amplitude of the largest seismic wave of a magnitude 5 quake is 10 times that of a magnitude 4 quake and 100 times that of a magnitude 3 quake.
How does an increase in two integers on the moment magnitude scale compare in terms of the amount of energy released? Two integers equals a 900-fold increase in released energy.
Which scale do you think is best? With the Richter scale, a single sharp jolt measures higher than a very long intense earthquake that releases more energy. The moment magnitude scale more accurately reflects the energy released and the damage caused. Most seismologists now use the moment magnitude scale.
Earthquake Prediction
Scientists are a long way from being able to predict earthquakes. A good prediction must be accurate as to where an earthquake will occur, when it will occur, and at what magnitude it will be so that people can evacuate. An unnecessary evacuation is expensive and causes people not to believe authorities the next time an evacuation is ordered.
Where an earthquake will occur is the easiest feature to predict. Scientists know that earthquakes take place at plate boundaries and tend to happen where they’ve occurred before. Earthquake-prone communities should always be prepared for an earthquake. These communities can implement building codes to make structures earthquake safe.
When an earthquake will occur is much more difficult to predict. Since stress on a fault builds up at the same rate over time, earthquakes should occur at regular intervals. But so far scientists cannot predict when quakes will occur even to within a few years.
Signs sometimes come before a large earthquake. Small quakes, called foreshocks, sometimes occur a few seconds to a few weeks before a major quake. However, many earthquakes do not have foreshocks and small earthquakes are not necessarily followed by a large earthquake. Often, the rocks around a fault will dilate as microfractures form. Ground tilting, caused by the buildup of stress in the rocks, may precede a large earthquake, but not always. Water levels in wells fluctuate as water moves into or out of fractures before an earthquake. This is also an uncertain predictor of large earthquakes. The relative arrival times of P-waves and S-waves also decreases just before an earthquake occurs.
Folklore tells of animals behaving erratically just before an earthquake. Mostly these anecdotes are told after the earthquake. If indeed animals sense danger from earthquakes or tsunami, scientists do not know what it is they could be sensing, but they would like to find out.
Questions:
1. What is an earthquake’s focus? What is its epicenter?
2. Why do most earthquakes take place along plate boundaries?
3. Using elastic rebound theory, describe what triggers an earthquake.
4. What types of materials can P-waves travel through and how fast are they? Describe a P-wave’s motion.
5. What material can S-waves travel through and how fast are they? Describe an S-wave’s motion.
6. How are surface waves different from body waves? Which are more damaging?
7. On a seismogram, which waves arrive first, second, third, and last?
8. What information is needed to calculate the distance from a seismic station to an earthquake’s epicenter?
9. If a seismogram records P-waves and surface waves but not S-waves, where was the earthquake epicenter located relative to the seismograph and why?
10. Why is the moment magnitude scale thought to be more accurate than the Richter scale for measuring earthquake magnitudes?
