Day 6 by 12/3 (A) 12/4 (B)
Introduction
Weather forecasts are better than they ever have been. According to the World Meteorological Organization (WMO), a 5-day weather forecast today is as reliable as a 2-day forecast was 20 years ago! This is because forecasters now use advanced technologies to gather weather data, along with the world’s most powerful computers. Together, the data and computers produce complex models that more accurately represent the conditions of the atmosphere. These models can be programmed to predict how the atmosphere and the weather will change. Despite these advances, weather forecasts are still often incorrect. Weather is extremely difficult to predict because it is a complex and chaotic system.
Collecting Weather Data
To make a weather forecast, the conditions of the atmosphere must be known for that location and for the surrounding area. Temperature, air pressure, and other characteristics of the atmosphere must be measured and the data collected.
Thermometer
Thermometers measure temperature. In an old-style mercury thermometer, mercury is placed in a long, very narrow tube with a bulb. Because mercury is temperature sensitive, it expands when temperatures are high and contracts when they are low. A scale on the outside of the thermometer matches up with the air temperature.
Some modern thermometers use a coiled strip composed of two kinds of metal, each of which conducts heat differently. As the temperature rises and falls, the coil unfolds or curls up tighter. Other modern thermometers measure infrared radiation or electrical resistance. Modern thermometers usually produce digital data that can be fed directly into a computer.
Barometer
Meteorologists use barometers to measure air pressure (Figure below). A barometer may contain water, air, or mercury, but like thermometers, barometers are now mostly digital.
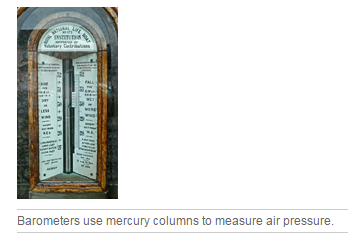
A change in barometric pressure indicates that a change in weather is coming. If air pressure rises, a high pressure cell is on the way and clear skies can be expected. If pressure falls, a low pressure cell is coming and will likely bring storm clouds. Barometric pressure data over a larger area can be used to identify pressure systems, fronts, and other weather systems.
Weather Stations
Weather stations contain some type of thermometer and barometer. Other instruments measure different characteristics of the atmosphere such as wind speed, wind direction, humidity, and amount of precipitation. These instruments are placed in various locations so that they can check the atmospheric characteristics of that location (Figure below).
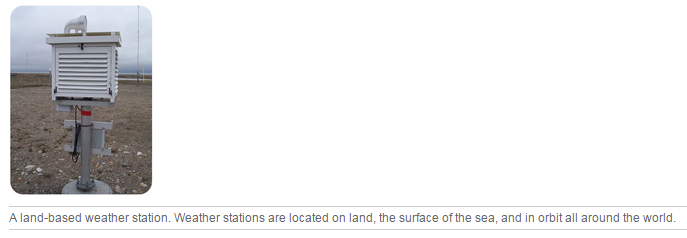
According to the WMO, weather information is collected from 15 satellites, 100 stationary buoys, 600 drifting buoys, 3,000 aircraft, 7,300 ships, and some 10,000 land-based stations.
Radiosondes
Radiosondes measure atmospheric characteristics, such as temperature, pressure, and humidity as they move through the air (Figure below). Radiosondes in flight can be tracked to obtain wind speed and direction. Radiosondes use a radio to communicate the data they collect to a computer.
Radiosondes
Radiosondes measure atmospheric characteristics, such as temperature, pressure, and humidity as they move through the air (Figure below). Radiosondes in flight can be tracked to obtain wind speed and direction. Radiosondes use a radio to communicate the data they collect to a computer.
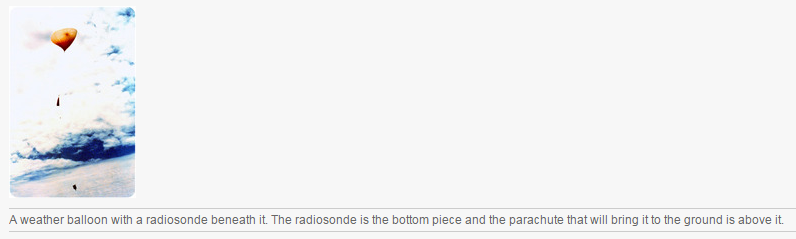
Radiosondes are launched from about 800 sites around the globe twice daily to provide a profile of the atmosphere. Radiosondes can be dropped from a balloon or airplane to make measurements as they fall. This is done to monitor storms, for example, since they are dangerous places for airplanes to fly.
Radar
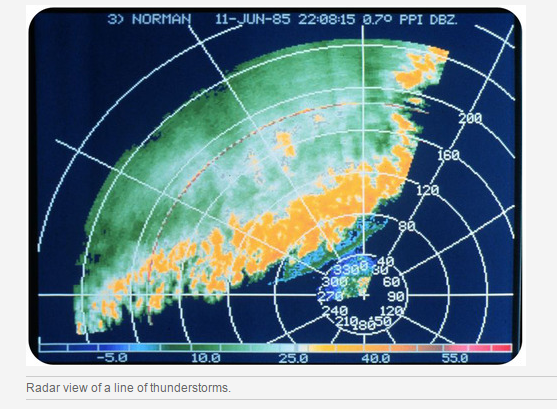
Radar stands for Radio Detection and Ranging (Figure below). A transmitter sends out radio waves that bounce off the nearest object and then return to a receiver. Weather radar can sense many characteristics of precipitation: its location, motion, intensity, and the likelihood of future precipitation. Doppler radar can also track how fast the precipitation falls. Radar can outline the structure of a storm and can be used to estimate its possible effects.
Radar
Radar stands for Radio Detection and Ranging (Figure below). A transmitter sends out radio waves that bounce off the nearest object and then return to a receiver. Weather radar can sense many characteristics of precipitation: its location, motion, intensity, and the likelihood of future precipitation. Doppler radar can also track how fast the precipitation falls. Radar can outline the structure of a storm and can be used to estimate its possible effects.
Satellites
Weather satellites have been increasingly important sources of weather data since the first one was launched in 1952. Weather satellites are the best way to monitor large scale systems, such as storms. Satellites are able to record long-term changes, such as the amount of ice cover over the Arctic Ocean in September each year.
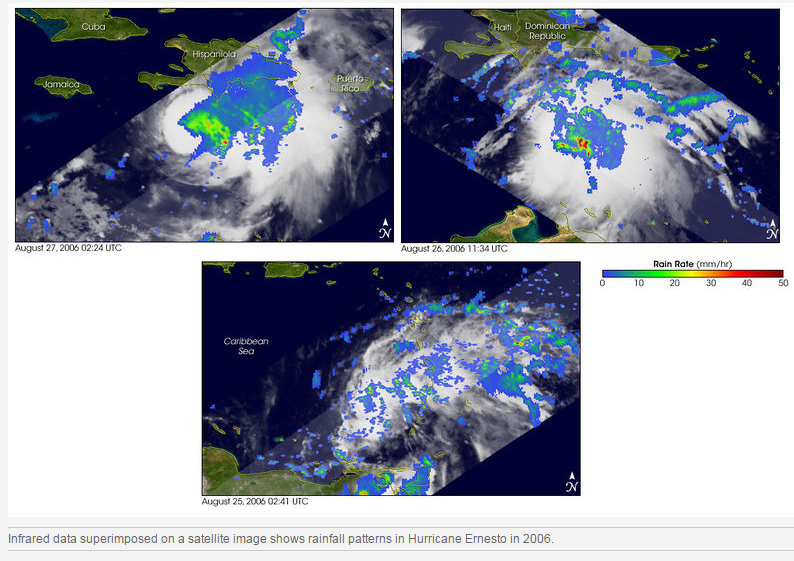
Weather satellites may observe all energy from all wavelengths in the electromagnetic spectrum. Visible light images record storms, clouds, fires, and smog. Infrared images record clouds, water and land temperatures, and features of the ocean, such as ocean currents (Figure below).
Weather satellites have been increasingly important sources of weather data since the first one was launched in 1952. Weather satellites are the best way to monitor large scale systems, such as storms. Satellites are able to record long-term changes, such as the amount of ice cover over the Arctic Ocean in September each year.
Weather satellites may observe all energy from all wavelengths in the electromagnetic spectrum. Visible light images record storms, clouds, fires, and smog. Infrared images record clouds, water and land temperatures, and features of the ocean, such as ocean currents (Figure below).
Numerical Weather Prediction
The most accurate weather forecasts are made by advanced computers, with analysis and interpretation added by experienced meteorologists. These computers have up-to-date mathematical models that can use much more data and make many more calculations than would ever be possible by scientists working with just maps and calculators. Meteorologists can use these results to give much more accurate weather forecasts and climate predictions.
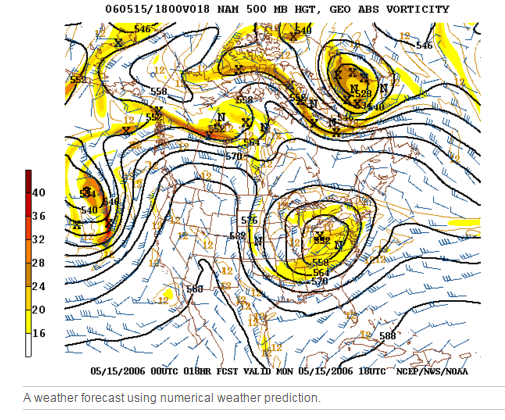
In Numerical Weather Prediction (NWP), atmospheric data from many sources are plugged into supercomputers running complex mathematical models (Figure below). The models then calculate what will happen over time at various altitudes for a grid of evenly spaced locations. The grid points are usually between 10 and 200 kilometers apart. Using the results calculated by the model, the program projects weather further into the future. It then uses these results to project the weather still further into the future, as far as the meteorologists want to go. Once a forecast is made, it is broadcast by satellites to more than 1,000 sites around the world.
The most accurate weather forecasts are made by advanced computers, with analysis and interpretation added by experienced meteorologists. These computers have up-to-date mathematical models that can use much more data and make many more calculations than would ever be possible by scientists working with just maps and calculators. Meteorologists can use these results to give much more accurate weather forecasts and climate predictions.
In Numerical Weather Prediction (NWP), atmospheric data from many sources are plugged into supercomputers running complex mathematical models (Figure below). The models then calculate what will happen over time at various altitudes for a grid of evenly spaced locations. The grid points are usually between 10 and 200 kilometers apart. Using the results calculated by the model, the program projects weather further into the future. It then uses these results to project the weather still further into the future, as far as the meteorologists want to go. Once a forecast is made, it is broadcast by satellites to more than 1,000 sites around the world.
NWP produces the most accurate weather forecasts, but as anyone knows, even the best forecasts are not always right.
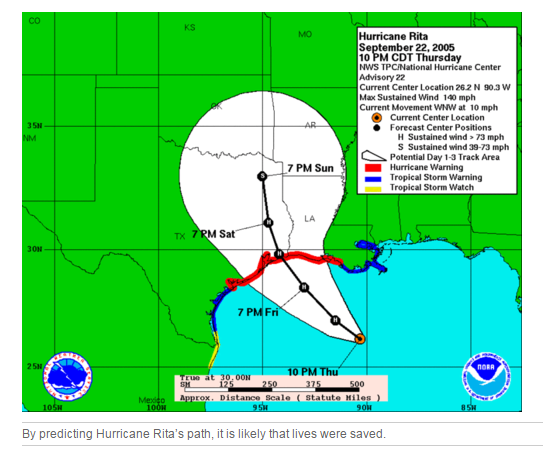
Weather prediction is extremely valuable for reducing property damage and even fatalities. If the proposed track of a hurricane can be predicted, people can try to secure their property and then evacuate (Figure below).
Weather prediction is extremely valuable for reducing property damage and even fatalities. If the proposed track of a hurricane can be predicted, people can try to secure their property and then evacuate (Figure below).
Weather Maps
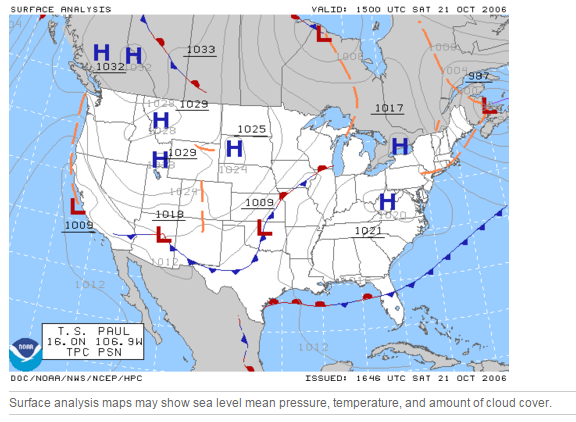
Weather maps simply and graphically depict meteorological conditions in the atmosphere. Weather maps may display only one feature of the atmosphere or multiple features. They can depict information from computer models or from human observations.
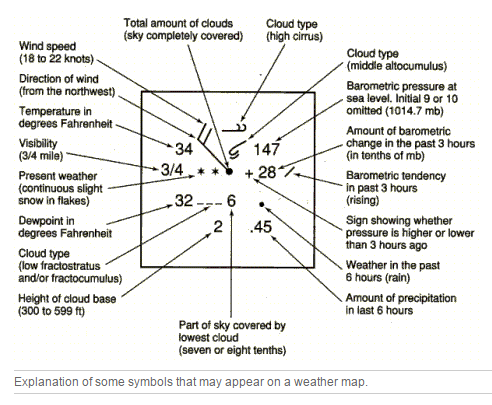
On a weather map, important meteorological conditions are plotted for each weather station. Meteorologists use many different symbols as a quick and easy way to display information on the map (Figure below).
Weather maps simply and graphically depict meteorological conditions in the atmosphere. Weather maps may display only one feature of the atmosphere or multiple features. They can depict information from computer models or from human observations.
On a weather map, important meteorological conditions are plotted for each weather station. Meteorologists use many different symbols as a quick and easy way to display information on the map (Figure below).
Once conditions have been plotted, points of equal value can be connected by isolines. Weather maps can have many types of connecting lines. For example:
- Lines of equal temperature are called isotherms. Isotherms show temperature gradients and can indicate the location of a front. In terms of precipitation, what does the 0°C (32°F) isotherm show?
- Isobars are lines of equal average air pressure at sea level (Figure below). Closed isobars represent the locations of high and low pressure cells.
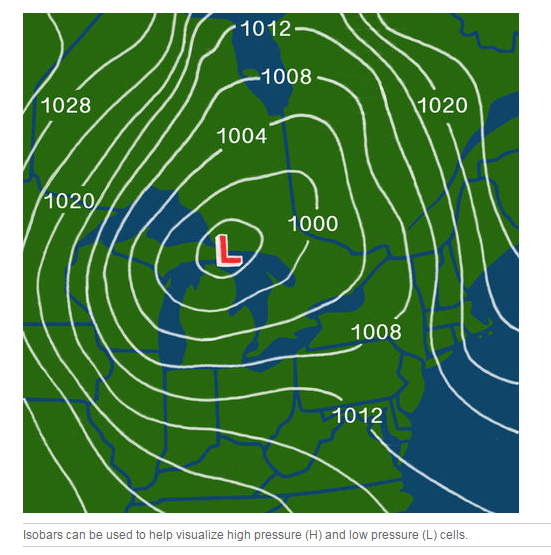
- Isotachs are lines of constant wind speed. Where the minimum values occur high in the atmosphere, tropical cyclones may develop. The highest wind speeds can be used to locate the jet stream.
Questions:
1. How could a barometer at a single weather station predict an approaching storm?
2. How does radar work, and what is its value in weather prediction?
3. With so much advanced technology available, what is the role of meteorologists in creating accurate weather forecasts?
4. With so much advanced technology available, why are weather forecasts so often wrong?
