Day 5 - Due 9/6(A) & 9/9(B)
1.1 - Earth Systems & Literacy
Graphing
Reading Assignment
Graphing
Presenting Scientific Data
Scientists accumulate vast amounts of data by observing events and making measurements. After scientists organize data in tables, they may display the data in a graph. A graph is a diagram that shows the relationship of one variable to another. A graph makes interpretation and analysis of data easier. There are three basic types of graphs used in science - the line graph, the bar graph, and the pie graph.
What is a graph?
Graphs are one of the most useful ways to organize and analyze quantitative data. Graphs show patterns, communicate information, and allow scientists to make predictions that can support or disprove a hypothesis. Graphs help us see information better. When we have a lot of information, graphs put all the information in one place so that we can see it quickly and refer to it more easily. The visual characteristics of a graph make trends in data easy to see.
When you use graphs, think carefully about the conclusions you can draw from them. You want to make sure your conclusions are based on accurate information and that you use scales that help make your graph easy to read.
One of the most valuable uses for graphs is to show data collected during an experiment. The graph shows your results.
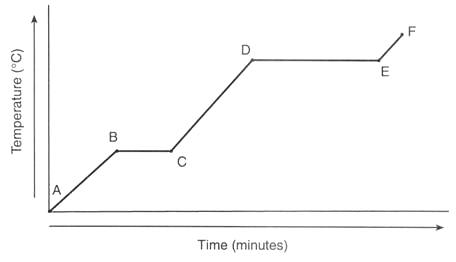
Line graphs
In laboratory experiments, you will usually be controlling one variable and seeing how it affects another variable. A line graph is used to show the relationship between two variables. The variables being compared go on two axes of the graph. You can do a number of things with the information in a line graph:
Graphing
Presenting Scientific Data
Scientists accumulate vast amounts of data by observing events and making measurements. After scientists organize data in tables, they may display the data in a graph. A graph is a diagram that shows the relationship of one variable to another. A graph makes interpretation and analysis of data easier. There are three basic types of graphs used in science - the line graph, the bar graph, and the pie graph.
What is a graph?
Graphs are one of the most useful ways to organize and analyze quantitative data. Graphs show patterns, communicate information, and allow scientists to make predictions that can support or disprove a hypothesis. Graphs help us see information better. When we have a lot of information, graphs put all the information in one place so that we can see it quickly and refer to it more easily. The visual characteristics of a graph make trends in data easy to see.
When you use graphs, think carefully about the conclusions you can draw from them. You want to make sure your conclusions are based on accurate information and that you use scales that help make your graph easy to read.
One of the most valuable uses for graphs is to show data collected during an experiment. The graph shows your results.
Line graphs
In laboratory experiments, you will usually be controlling one variable and seeing how it affects another variable. A line graph is used to show the relationship between two variables. The variables being compared go on two axes of the graph. You can do a number of things with the information in a line graph:
- You can determine how a variable changes over time,
- Given one variable, the other variable can be determined,
- You can show trends in the data, and
- You can make predictions about data that is not recorded
- Determine the Independent Variable
The independent variable (aka the manipulated variable) is the one you have control over or the thing you change. In a line graph, the independent variable always goes on the x-axis..
- Determine the Dependent Variable
The dependent variable (aka the responding variable) is the one you don't have control over or the thing that changes when you change the independent variable. In a line graph the dependent variable always goes on the y-axis.
Bar graphs
Bar graphs are similar to line graphs. They compare data that do not continuously change. In a bar graph, vertical bars show the relationships among data. Bar graphs make it easy to compare data quickly. A bar graph is useful when you want to compare information collected by counting, or similar data for several individual items or events. Use a bar graph if you are not looking for trends (or patterns) over time and the items (or categories) are not parts of a whole.
A bar graph makes it easy to see how the data for one item compares with the data for another.
To make a bar graph, set up the x-axis and y-axis as you did for the line graph. The data is plotted by drawing vertical bars from the x-axis up to a point where the y-axis would meet the bar if it were extended.
An example of the type of data you might use for a bar graph could be Preventable Causes of Death as seen below.
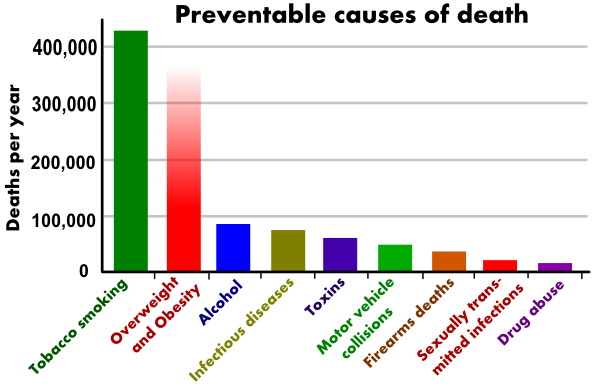
A bar graph might be appropriate for comparing different trials or different experimental groups. It also may be a good choice if your independent variable is not numerical.
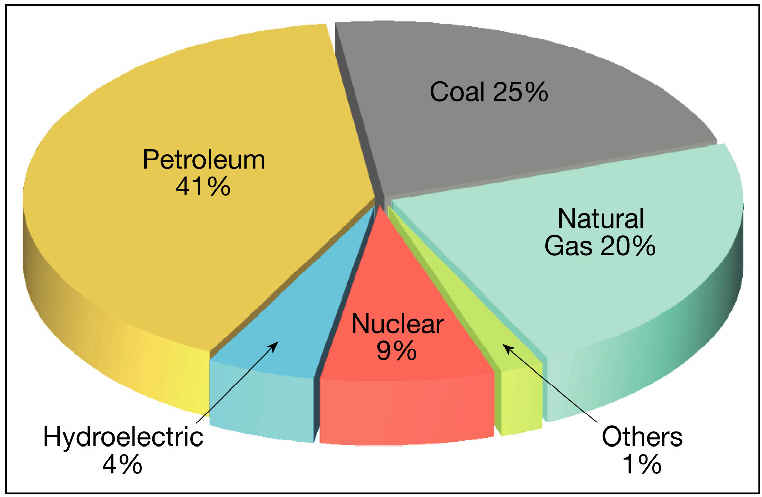
Pie Graphs
Pie graphs use a circle divided into sections to display data. Each section represents part of the whole. All the sections together equal 100 percent. Pie graphs (aka pie charts or circle graphs) are an easy way to visualize how parts make up a whole. For example you could use a pie graph if you need to compare different parts of a whole, where there is no time involved and there are not too many items (or categories).
The figure below is a pie graph that describes the energy consumption in the United States. The entire circle represents the types of energy used in the United States. Each "slice" of the pie represents a percentage of each type of energy being used.
How do I make a graph without using paper? Helpful Links:
Constructing a graph using Microsoft Word
Constructing a graph using Microsoft Word 2007
Constructing a graph using Microsoft Excel
Web-based graphing tool createagraph
Graphing Checklist
What Makes for a Good Graph? For a Good Graph, You Should Answer "Yes" to Every Question
Have you selected the appropriate graph type for the data you are displaying?
Yes / No
Does your graph have a title?
Yes / No
Have you placed the independent variable on the x-axis and the dependent variable on the y-axis?
Yes / No
Have you labeled the axes correctly and specified the units of measurement?
Yes / No
Does your graph have the proper scale (the appropriate high and low values on the axes)?
Yes / No
Is your data plotted correctly and clearly?
Yes / No
QUESTIONS:
1. Why are graphs useful?
2. When is the best time to use each of the following graphs?
3. Graph the data from the following table. Make sure to use the graphing checklist!
Constructing a graph using Microsoft Word
Constructing a graph using Microsoft Word 2007
Constructing a graph using Microsoft Excel
Web-based graphing tool createagraph
Graphing Checklist
What Makes for a Good Graph? For a Good Graph, You Should Answer "Yes" to Every Question
Have you selected the appropriate graph type for the data you are displaying?
Yes / No
Does your graph have a title?
Yes / No
Have you placed the independent variable on the x-axis and the dependent variable on the y-axis?
Yes / No
Have you labeled the axes correctly and specified the units of measurement?
Yes / No
Does your graph have the proper scale (the appropriate high and low values on the axes)?
Yes / No
Is your data plotted correctly and clearly?
Yes / No
QUESTIONS:
1. Why are graphs useful?
2. When is the best time to use each of the following graphs?
- line graph
- bar graph
- pie graph
3. Graph the data from the following table. Make sure to use the graphing checklist!
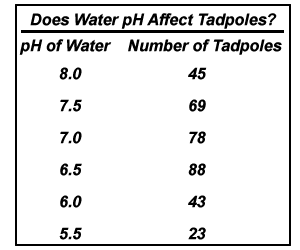
4. Interpret the data from your graph.
